Table of Contents
Resource Management
There are three ways in which a manager can see allocation of time and tasks for each one of their team workers.
These are:
- In the tasks module, using the “view as list” option.
- In the tasks module, using the “view as Gantt” option.
- By generating reports.
Note: The Gantt Chart module is an additional plugin available for the Professional and Enterprise Editions.
Managing Resources with tasks - "list view"
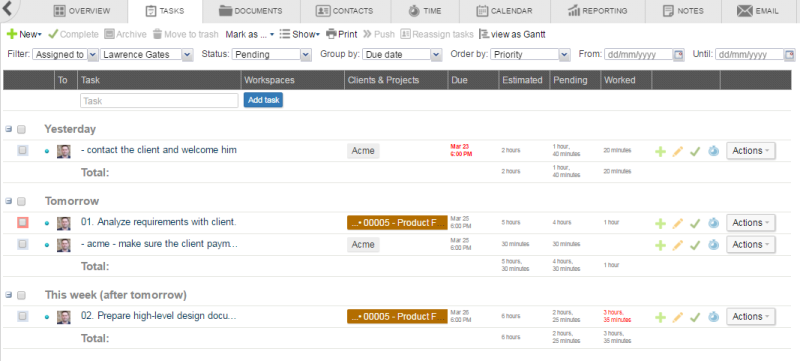
Let´s say you want to see the projects user Lawrence Gates is working on, the estimated and pending work hours grouped by due dates, and for how long will his agenda be complete. Our recommendation in this case is the following:
- Go to the Tasks tab
- Apply the following filters on the toolbar
In this example, the tasks shown will be the pending tasks that are assigned to user “Lawrence Gates”, and they will be grouped by Due Date and ordered by Priority. For this example, you will get a result similar to this one:
For more information on the Task List and how it works, please follow this link
Managing Resources with tasks - "Gantt Chart view"
In order to access the view, you have to do the following:
- Go to the Tasks tab
- Select View as Gantt as shown below
Note: If you would like to go back to the previous view, just select View as List afterwards.
Following the previous example, the final results would be similar to the following:
Color coding
The tasks will be displayed with different colours:
- Yellow: Summary for that group, also known as “hammock”
- Blue: Pending tasks, but not due yet
- Red: Pending and due tasks
- Green: Completed tasks
- Orange: Beginning and ending of each tasks group (the beginning of the task that starts first and the ending of the task that finishes last)
For more information on the Gantt Chart and how it works, please follow this link
Managing Resources with reports
Reports are also a really useful way of gathering information on resources allocation. The type of report you can generate will vary according to the scope of the information you want to gather.
You can generate Tasks reports, which can also be generated for a specific user (for a more narrow search).
If there is any information you think may be a useful addition and is not included on the standard reports, you can even generate your own Customized Reports.


