Table of Contents
[ Notes | E-Mails | Contacts | Calendar | Documents | Tasks | Web Links | Time | Reporting ]
Reporting
In Feng Office you usually keep lots of data. However, if you are not able to run specific reports, that data may be useless.. and that is the difference between data and information. Information does provide ordered, useful and meaningful facts composed by data sets, whereas raw data may not be as helpful.
That being said, our Reporting Module has been created as flexible as possible so that you can save time and get all the information - processed data - you need.
In order to achieve it, you may run the Standard or General reports, or even create a Custom report of your own!
Reports basics
First and foremost it is important to understand that users will only be able to access information that is generated by the data they have access to.
This means if they do not have permission to a specific project, client, etc., they will definitely not be able to access information within it.
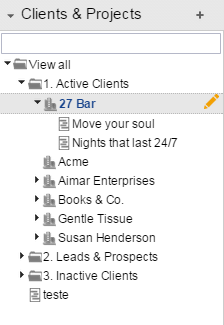
On the other hand, another interesting fact to take into account is that you may filter the reports by Client, Project, Folder, Workspace, Tag, etc. In order to achieve this you only need to stand on the, for instance, the client in question on the left side bar, and then proceed running the report. Look at the example below:
This means if you run the report standing here, you will get information related to the client called 27 Bar as well as from their inner projects called Move your soul and Nights that last 24/7. In case you only want to get information from Move your soul, you just need to stand on it on the left side.
Last but not least, in case you would like to get the general picture of everything, you only need to stand on View all on the left side.
Standard or General reports
These reports are the ones that have already been included in the system by default as most people find them useful.
The first one is the one called Total task execution time, very useful to run Time Reports.
The following ones have been created to get tasks information even easier and faster than before, and to play with more different options. Please bear in mind these reports are included in a plugin called Advanced Reports which is only available for the Professional Edition and Enterprise Edition of Feng Office.
Time reports
In order to run a time report, you may do it from two different places, obtaining the same results:
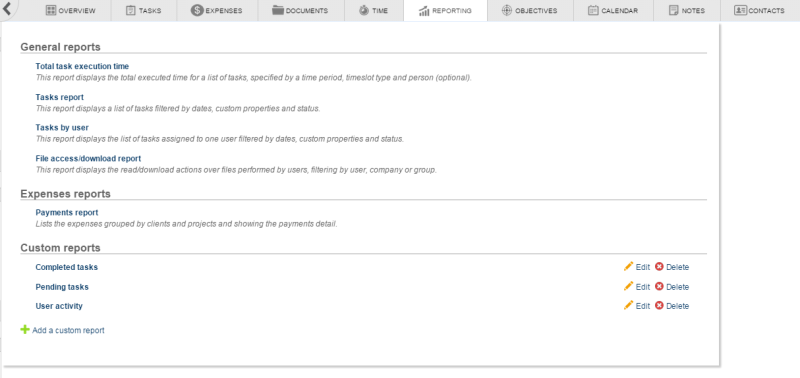
1- Go to the Reporting tab and click on Total task execution time
or
2- Go to the Time tab and click on Run Report, above, on your right.
For further information about tabs and modules activation, please visit this article.
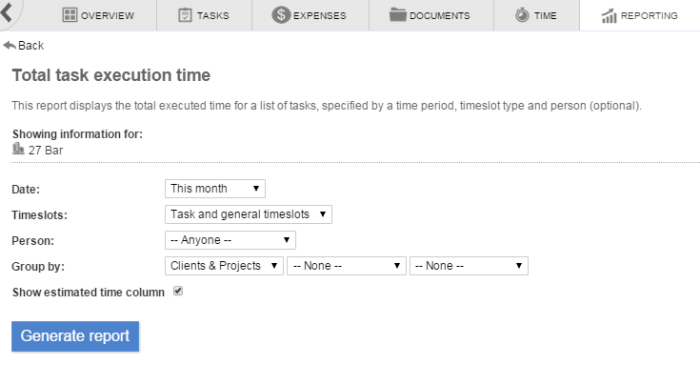
Once you access it you will see a screen as following:
Then you would have to select the options you wish to have in the report, taking into account the following:
Date: In here you will be able to filter the timeslots by date (i.e.: getting all of the information from this past month). Options here are:
- Today: shows information from today
- This week: shows information from this week
- Last week: shows information from last week
- This month: shows information from this month
- Last month: shows information from last month
- Select dates..: here you will be able to select a range of dates at will
Timeslots: Here you may choose different options:
- General timeslots: get a list of timeslots added within a client, project, workspace, etc. but not within a task per se
- Tasks timeslots: get a list of the timeslots only added to tasks
- Tasks and general timeslots: both kinds of timeslots - this is the option we usually suggest using -
Person: This option allows you filtering by user. You may select a specific user, or leave it as –Anyone– to show everyones information.
Group by: In order to have the information ordered, you may play with different grouping options:
- User: groups the information by user
- Task: groups the information by task (useful when running task timeslots reports)
- Clients & Projects: groups the information by a Client, Project or Folders
- Workspaces: groups the information by Workspace
- Tags: groups the information by Tag
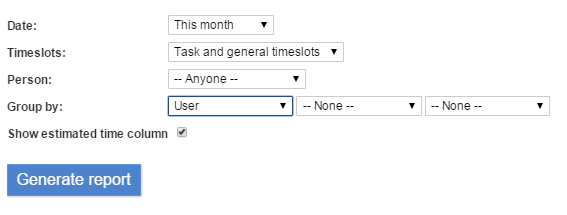
Lets have a look at the example below if we input the following information and are filtering by 27 Bar:
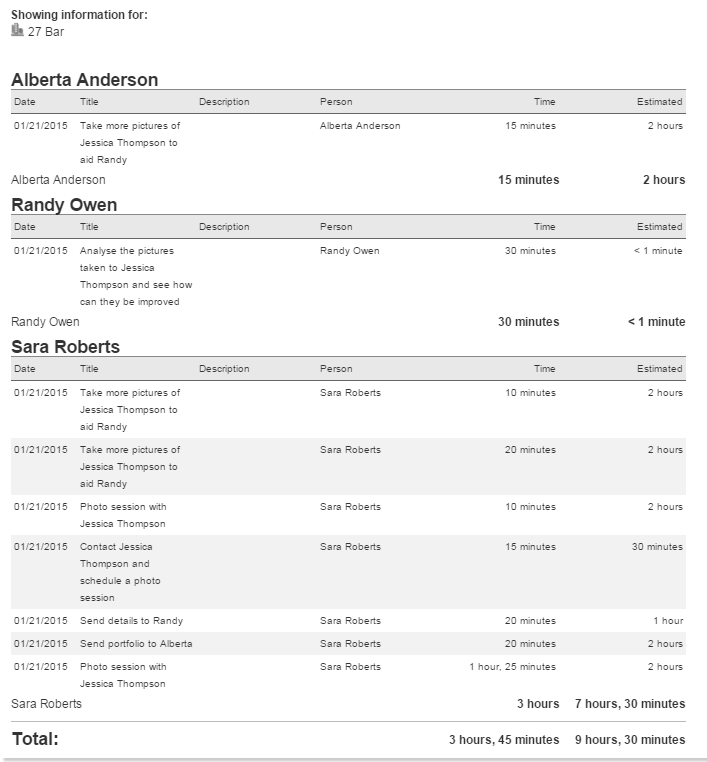
The result of running this report will be as follows:
Once you get the report, you will be able to:
1- Open it with the Print view so that you can print it in paper. Or you may as well print it into a .pdf file and then keep it yourself or share it somehow.
2- Export the report into a CSV file so that you can open it with your favourite spreadsheet and run other formulas or even create charts, or you may also
Tasks reports
There are two types of task reports in Feng Office: Tasks report and Tasks by user
Tasks report
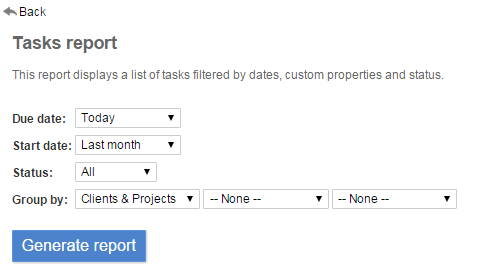
This report displays a list of tasks filtered by dates, custom properties and status.
1- Go to the Reporting tab and click on Tasks report
2- Choose the Start and Due Dates, the Task Status by which you want to filter and how you want to group the report.
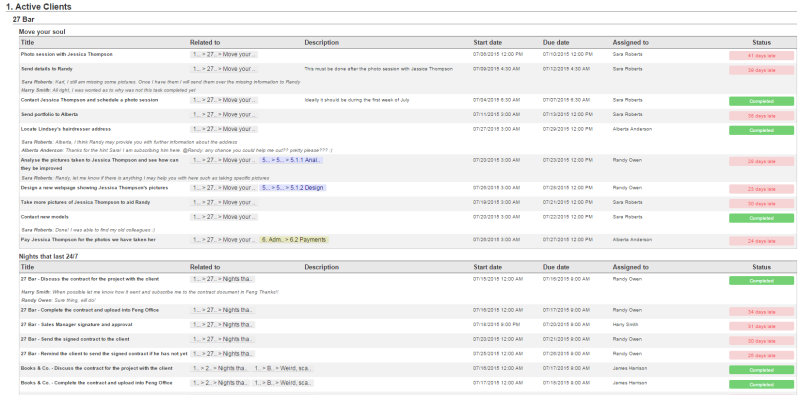
The generated report will look like the following:
Tasks by user
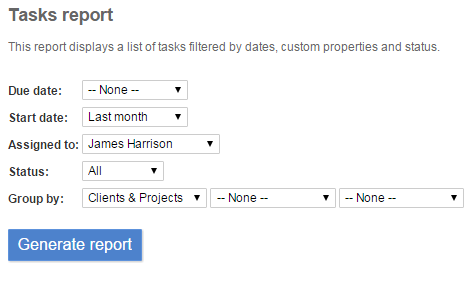
This report displays the list of tasks assigned to one user filtered by dates, custom properties and status.
1- Go to the Reporting tab and click on Tasks by user
2- Choose the Start and Due Dates, the User, the Task Status by which you want to filter and how you want to group the report.
The generated report will look like the following:
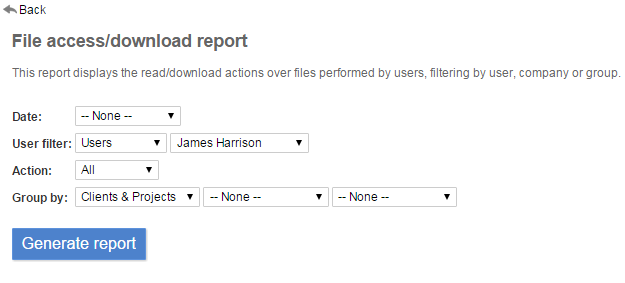
File access/download report
This report displays the read/download actions over files performed by users, filtering by user, company or group.
1- Go to the Reporting tab and click on File access/download report
2- Choose the Date, the User filter, the Action and how you want to group the report.
Custom Reports
In the previous section of this article we have already seen the reports that are included within the system. But sometimes those are not enough for our needs and requirement.
No worries! Feng is flexible enough to let you create your very own reports!
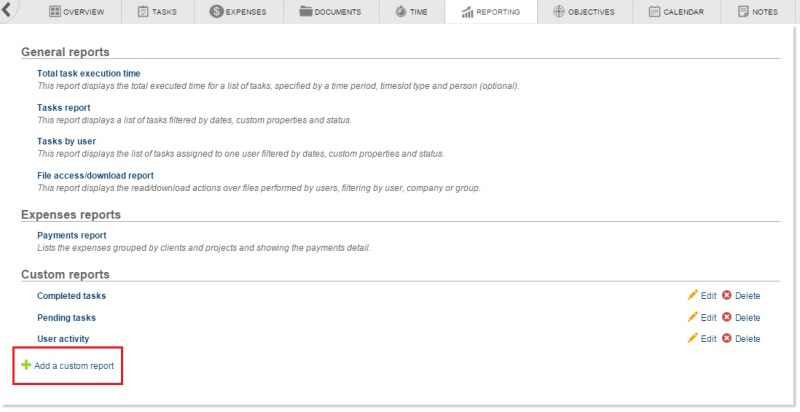
You only need to access the Reporting tab and then click on the Add a custom report
Headers
Next screen you will see is as follows:
The fields in there mean:
- Name: Choose a name (preferably short and significant)
- Description: Add a description (if the name does not speak for itself).
- Object type: Here you may choose whether it will be a tasks report, a documents report, and so on.
Lets add these values as an example:
Conditions
Once you select the Object type (in this example we have selected Tasks), you will be able to pick different Conditions to play with - or not, it is not compulsory -
Conditions are filters to be applied to your data, and you can combine several them if needed be.
Each condition consists of three elements:
- Field: This is the field to be searched for
- Condition: This is the operator (i.e. “equal”, “unequal”, “like”, “greater than”, “less than”, etc.)
- Value: This is the value for the condition
In order to add a condition, just click on Add condition and pick one of your like such as:
If you check the Parameter checkbox then the “Value” field will be input by you (or a colleague of yours) when running the actual report, instead of selecting a specific value right now.
Grouping Options
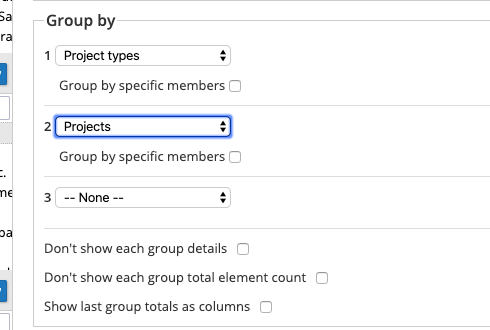
This section will allow you to define if and how you want to group the information obtained in the report.
In the example above, the report we will obtain will be grouped first by Project type, and inside this group, it will be further segmented by Project.
There are a couple of additional options available:
- Group by specific members: inside each specific grouping option, you will also be able to define whether the group is composed of specific members (for example, you could group a report by three specific project types, and exclude the rest)
- Don't show each group details: This excludes the group details from the report, showing only totals
- Don't show each group total element count: This removes the total element count displayed for each group by default
- Show last group totals as columns: If this option is checked, the totals for the last grouping option selected are presented in columns instead of rows.
Other Options
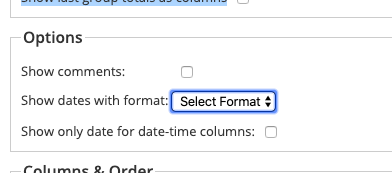
Other options for custom reports include:
- Show comments: Shows all comments made on the objects reported
- Show dates with format: Allows the user to select the preferred date format
- Show only date for date-time columns: If selected, any date-time columns included in the report will exclude the time.
Columns & Order
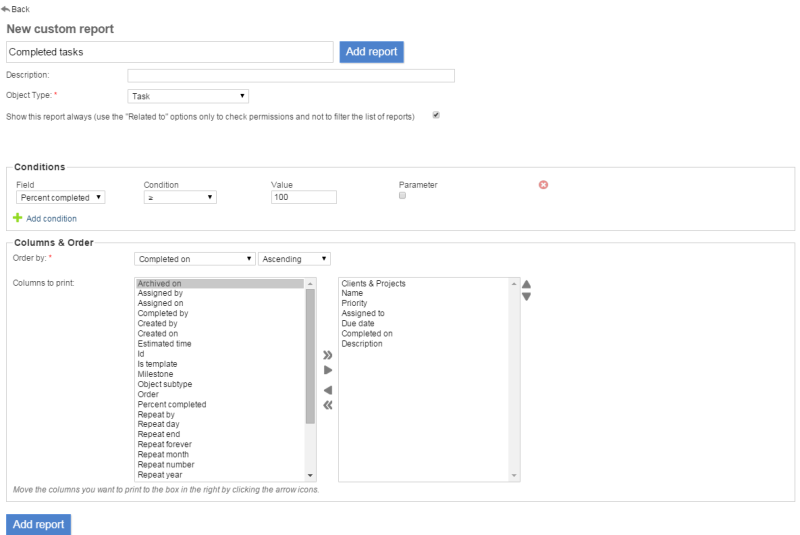
We are almost set now! Just need to select what information would you like to see in the report by selecting the different columns, and how would like to order it by.
For the ordering, you only need to select a field and then whether it will be Ascending or Descending order.
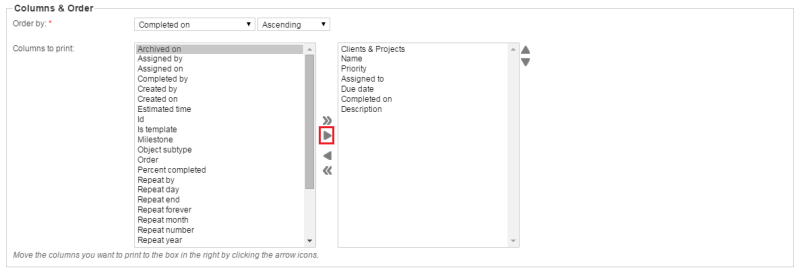
As to the values to show, you only need to select values on the left side, click on the arrow (the one marked in red below), and have it moved to the right side:
In the end the report will look something like this, and you will only need to save the changes:
Running the report
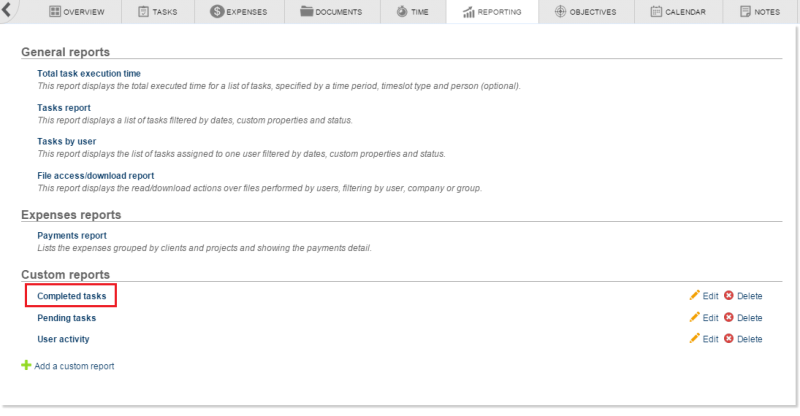
Once the report has been added, you only need to access it to run it.
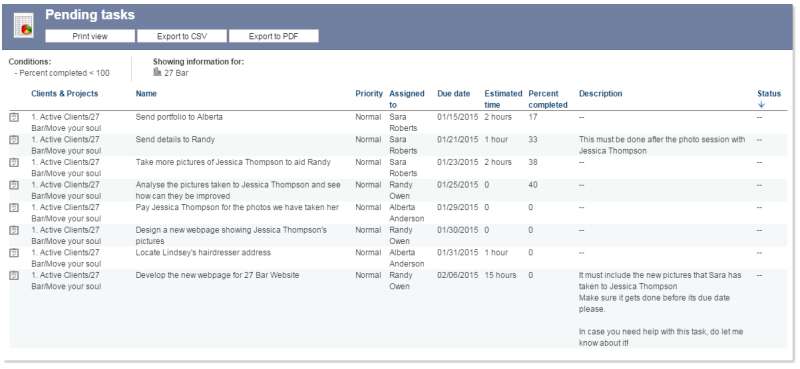
The result will be as follows:
After you get the results, you may:
1- Open it with the Print view so that you can print it in paper. Or you may as well print it into a .pdf file and then keep it yourself or share it somehow.
2- Export the report into a CSV file so that you can open it with your favourite spreadsheet and run other formulas or even create charts, or you may also
3- Export it to a PDF document directly. But we do not suggest going for this option as chances are the report will not be exported correctly. If you want to achieve this, look at the point number 1 and how to print it into a PDF.
Of course you can create your very own custom reports and get retrieve other useful information such as:
Please bear in mind you may also filter by Clients and Projects, as explained in this article above in the Reports Basics section
Specific developed reports
Project earnings report
Description:
Provides a high-level overview of the project's financial information. This was developed for a specific client. Later, a more standard and improved version was created as the “Projects financials” report
Columns retrieved:
- Project → 'Project number' _ 'Project name'
- Total budget → Contract amount.
- Revenue → Earned value (Executed price)
- Revenue vs. Budget (%) → “Earned value (vs. Contract amount)”
- Project progress → Project percent complete
- Total billed → Invoiced subtotal
- AR amount → Due amount
- Unbilled → Calculated. (Unbilled = Executed price - Invoiced_subtotal)
- Labor cost → Executed labor cost
- Expense cost → Executed expense cost
- Total spent → Executed cost
- Added value → Executed labor price
- Profit → Calculated as Revenue amount - Total spent
- Super/Profit loss → This is a custom property, it will only retrieved if enabled
- Potential provision → Calculated as Invoiced subtotal - Revenue amount
- Effective multiplier → Executed labor price / Executed labor cost
